Inflation
2026-02-10
Inflation is one of those words that is used when people talk about the economy and money.
Today we’re going to develop a deeper understanding of what inflation means.
Let’s start with a simplified Wikipedia definition.
It has three parts.
1) Inflation is an increase in the average price of goods and services.
2) This increase is typically measured in the U.S. by the consumer price index (CPI).
3) When the general price level rises, each dollar buys fewer goods and services.
Let’s take this step by step.
The first sentence is what most of us know.
Prices have gone up.
BOO!
Re-read the sentence again.
Because you missed a word.
Hint…
It’s the 7th word.
Average.
Average is a statistic.
And you know what Mark Twain said about statistics.
“There are three kinds of lies: lies, damned lies, and statistics.”
Averages are very useful numbers.
But…
Averages hide complexity.
Always.
We need them to make things simpler but if you only understand averages, you don’t really understand something.
On to the second sentence: “This increase is typically measured in the U.S. by the consumer price index (CPI).”
I’d bet 9 out of 10 people don’t know what the Consumer Price Index is.
The Bureau of Labor Statistics which is part of the U.S. The Department of Labor defines something called the CPI.
The CPI is designed to figure out for the average American what they on average spend their money on and how much that on average costs.
What did I say about averages?
We just hit 3 in one sentence.
They must need to boil an incredible amount of complexity down into one number.
And they do!
And you should also have some intuition that averaging while necessary often loses some amount of the underlying truth in the numbers.
The BLS takes the process of averaging about as seriously as any one can.
They survey tens of thousands of households on what they actually spend money on.
They use this data to assign weights to ~200 categories (housing, food, transportation, medical care, etc.).
The size of each category gets adjusted every two years.
Price collection is done by BLS field economists who physically visit or contact 80,000 retail establishments and 6,000 housing units monthly across 75 urban areas to record actual transaction prices on 94,000 specific items.
Why do they need to survey so many urban areas?
Because prices are not the same all over the United States.
A Washington apple might cost $1.50 per pound in Washington.
That same apple might cost $3.00 per pound in New York City.
Why?
Because the apple was kept cold during its 3,000 mile journey.
Another example would be gas.
Gas typically costs 60% more in California than in Texas.
Are they chilling the gasoline on its journey?
No. Don’t be silly.
It’s too long of an explanation to get into now but I will give you a hint that that is part of the reason why electric vehicles spread so quickly in California.
Ok so you get it. Lots and lots of prices from all over the country.
When they average all these prices together, some items are given some more weight and some less weight.
The weights reflect how much of your money you spend on that item.
So what are the weights today?
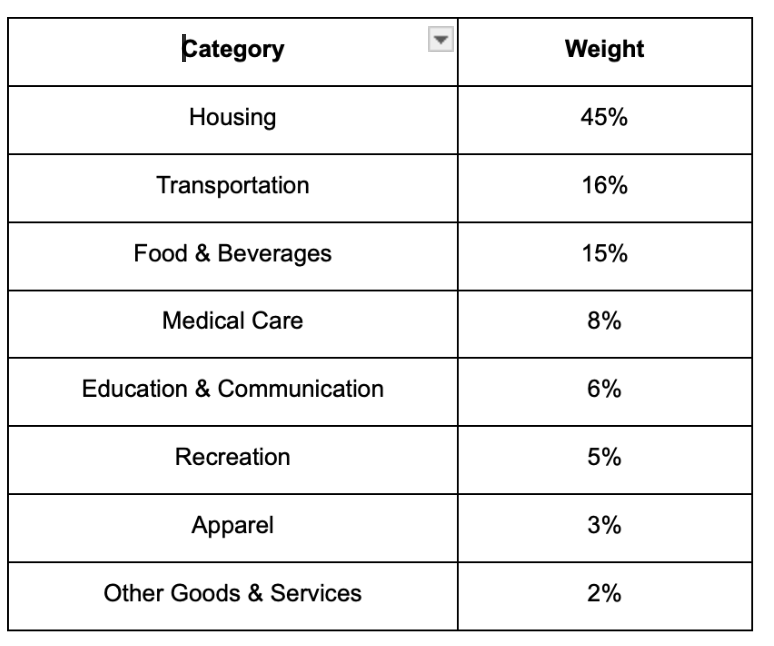
These make sense but it’s hard to reason about such large categories.
Let’s pick something smaller and more tangible.
Eggs.
An egg is pretty much an egg.
It doesn’t change over decades.
So let’s look at the price of an egg from when I was born in 1974 to today.
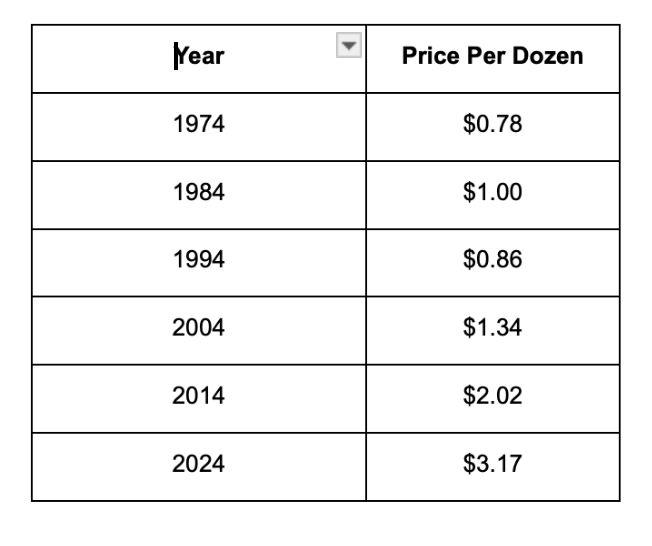
This table gives you an idea of how inflation directionally works.
50 years later a dozen eggs cost about 4 times more dollars than in 1974.
But wait.
In 1994 eggs cost less than 1984.
How can that happen?
That’s the decade that industrial egg farming took place.
We won’t get into the specifics (because they are gross) but that’s how eggs got cheaper.
Are all types of food tracked?
No.
For instance only these seven fruits are tracked: Red Delicious apples, bananas, Thompson seedless grapes, grapefruit, lemons, Navel oranges, and strawberries. The government does not care that I love Honeycrisp apples and their prices are through the roof!
Let’s try another example - college tuition.
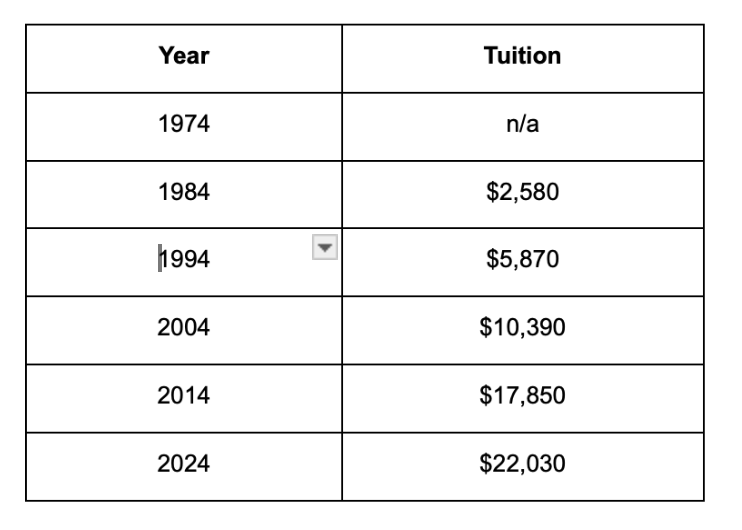
Even though about 1 in 4 kids went to college In 1974, college tuition was not in the index.
It was included starting in 1977.
Now this isn’t tuition at every college, just the ones they averaged.
Yale, for example, went up 20 times during that same period to $69,900 (not including books, room and board).
In order to compare eggs to tuition we will compare just 1984 to 2024.
Tuition in the CPi grew 10x while eggs grew 3x.
College tuition has more price inflation than eggs (well it does now that we industrially produce eggs).
On to the third sentence: “When the general price level rises, each dollar buys fewer goods and services.”
While we know from our examples this is probably true, what if you are making more money now than in 1974?
If you are making more money than the prices increase, the price will actually “feel” cheaper.
If you aren’t making more money, it will feel more expensive.
The CPI does not track income, another statistic does.
In 1974, the average household made $11,200.
In 2024, the average household made $83,730.
That’s 7.5 more money!
So you can eat the same number of eggs and spend less of your money.
However, the cost of college has grown faster than your income so it feels and is more expensive.
I hope this has given you a deeper understanding on inflation (and prices and statistics).
Next time, we’ll cover inflation’s more fun sibling - deflation.
See you soon!